To comply with my NDA, sensitive and confidential information has been removed or disguised. All content represents my own work and does not necessarily reflect the views of FloData.
Most enterprise software fails not because it lacks features,
but because it exposes complexity instead of managing it.
FloData is a leader in data integration and automation solutions, designed to help businesses navigate their digital transformations. Its Master Data Management platform centralises and harmonises data from multiple systems, ensuring accuracy, consistency, and real-time availability across an organisation.
MDM is one of the most technically demanding domains in enterprise software. At its core, it involves taking data from dozens of source systems, CRMs, ERPs, databases, data warehouses, identifying duplicate or conflicting records, applying rules to determine the "golden record," and making that clean, unified data available to every downstream system that needs it. The complexity is not optional. It is inherent to the problem.
"The challenge with MDM is not technical, most MDM platforms are technically capable. The challenge is human. The people who need to use it most are often the least equipped to navigate its complexity."
The existing FloData platform had been built by engineers for engineers. The technical depth was impressive, but the interface reflected the architecture of the system, not the mental models of the people who needed to govern it. A data steward responsible for data quality should not need to understand database schema logic to do their job. A business analyst should not need IT support to answer a question about entity relationships. The redesign started from a simple premise: what if the platform knew who you were, and showed you only what you needed?
The same platform. Three completely different jobs to be done.
The first design decision was architectural, not visual. Before any wireframe was drawn, the question was: who is actually using this, and what does failure look like for each of them? The answer revealed three fundamentally different user archetypes, each with their own cognitive load, their own definition of success, and their own breaking point.
The redesign principle that emerged from this persona work: the platform should feel different depending on who you are. Not just visually, functionally. A data steward's dashboard should surface data quality alerts. An IT admin's dashboard should surface job health. A business analyst's dashboard should surface entity insights. One login. Three completely different first screens. That was the design brief we wrote for ourselves, it was not in the original scope.
The best design decisions on this project
came from questions nobody had thought to ask.
The most important work on this project happened before any design tool was opened. It happened in stakeholder conversations, a process of deep questioning that built credibility and uncovered needs that the brief had not articulated.
The stakeholders knew what they wanted: a cleaner interface for the existing MDM workflows. What they had not yet articulated, because nobody had asked, was what would happen if a non-technical user needed to configure a matching rule. What would happen if a business analyst needed to understand why two records had been merged. What would happen when an admin needed to diagnose a job that had been running for three hours without completing.
The questions surfaced two fundamental gaps. First: there was no way for non-technical users to interact with the rules engine, the most powerful part of the platform, without developer support. Second: search was the entry point for almost every user journey, and the existing search was basic, context-free, and incapable of handling the ambiguous queries that real users typed.
"We did not arrive at the Canvas View by being clever. We arrived at it by asking 'what does a non-technical user do when they need to change a matching rule?' The answer was: nothing, because they can't. That question was the brief."
Five decisions. Two of them
were never in the plan.
Role-Based Dashboards, The Interface Knows Who You Are
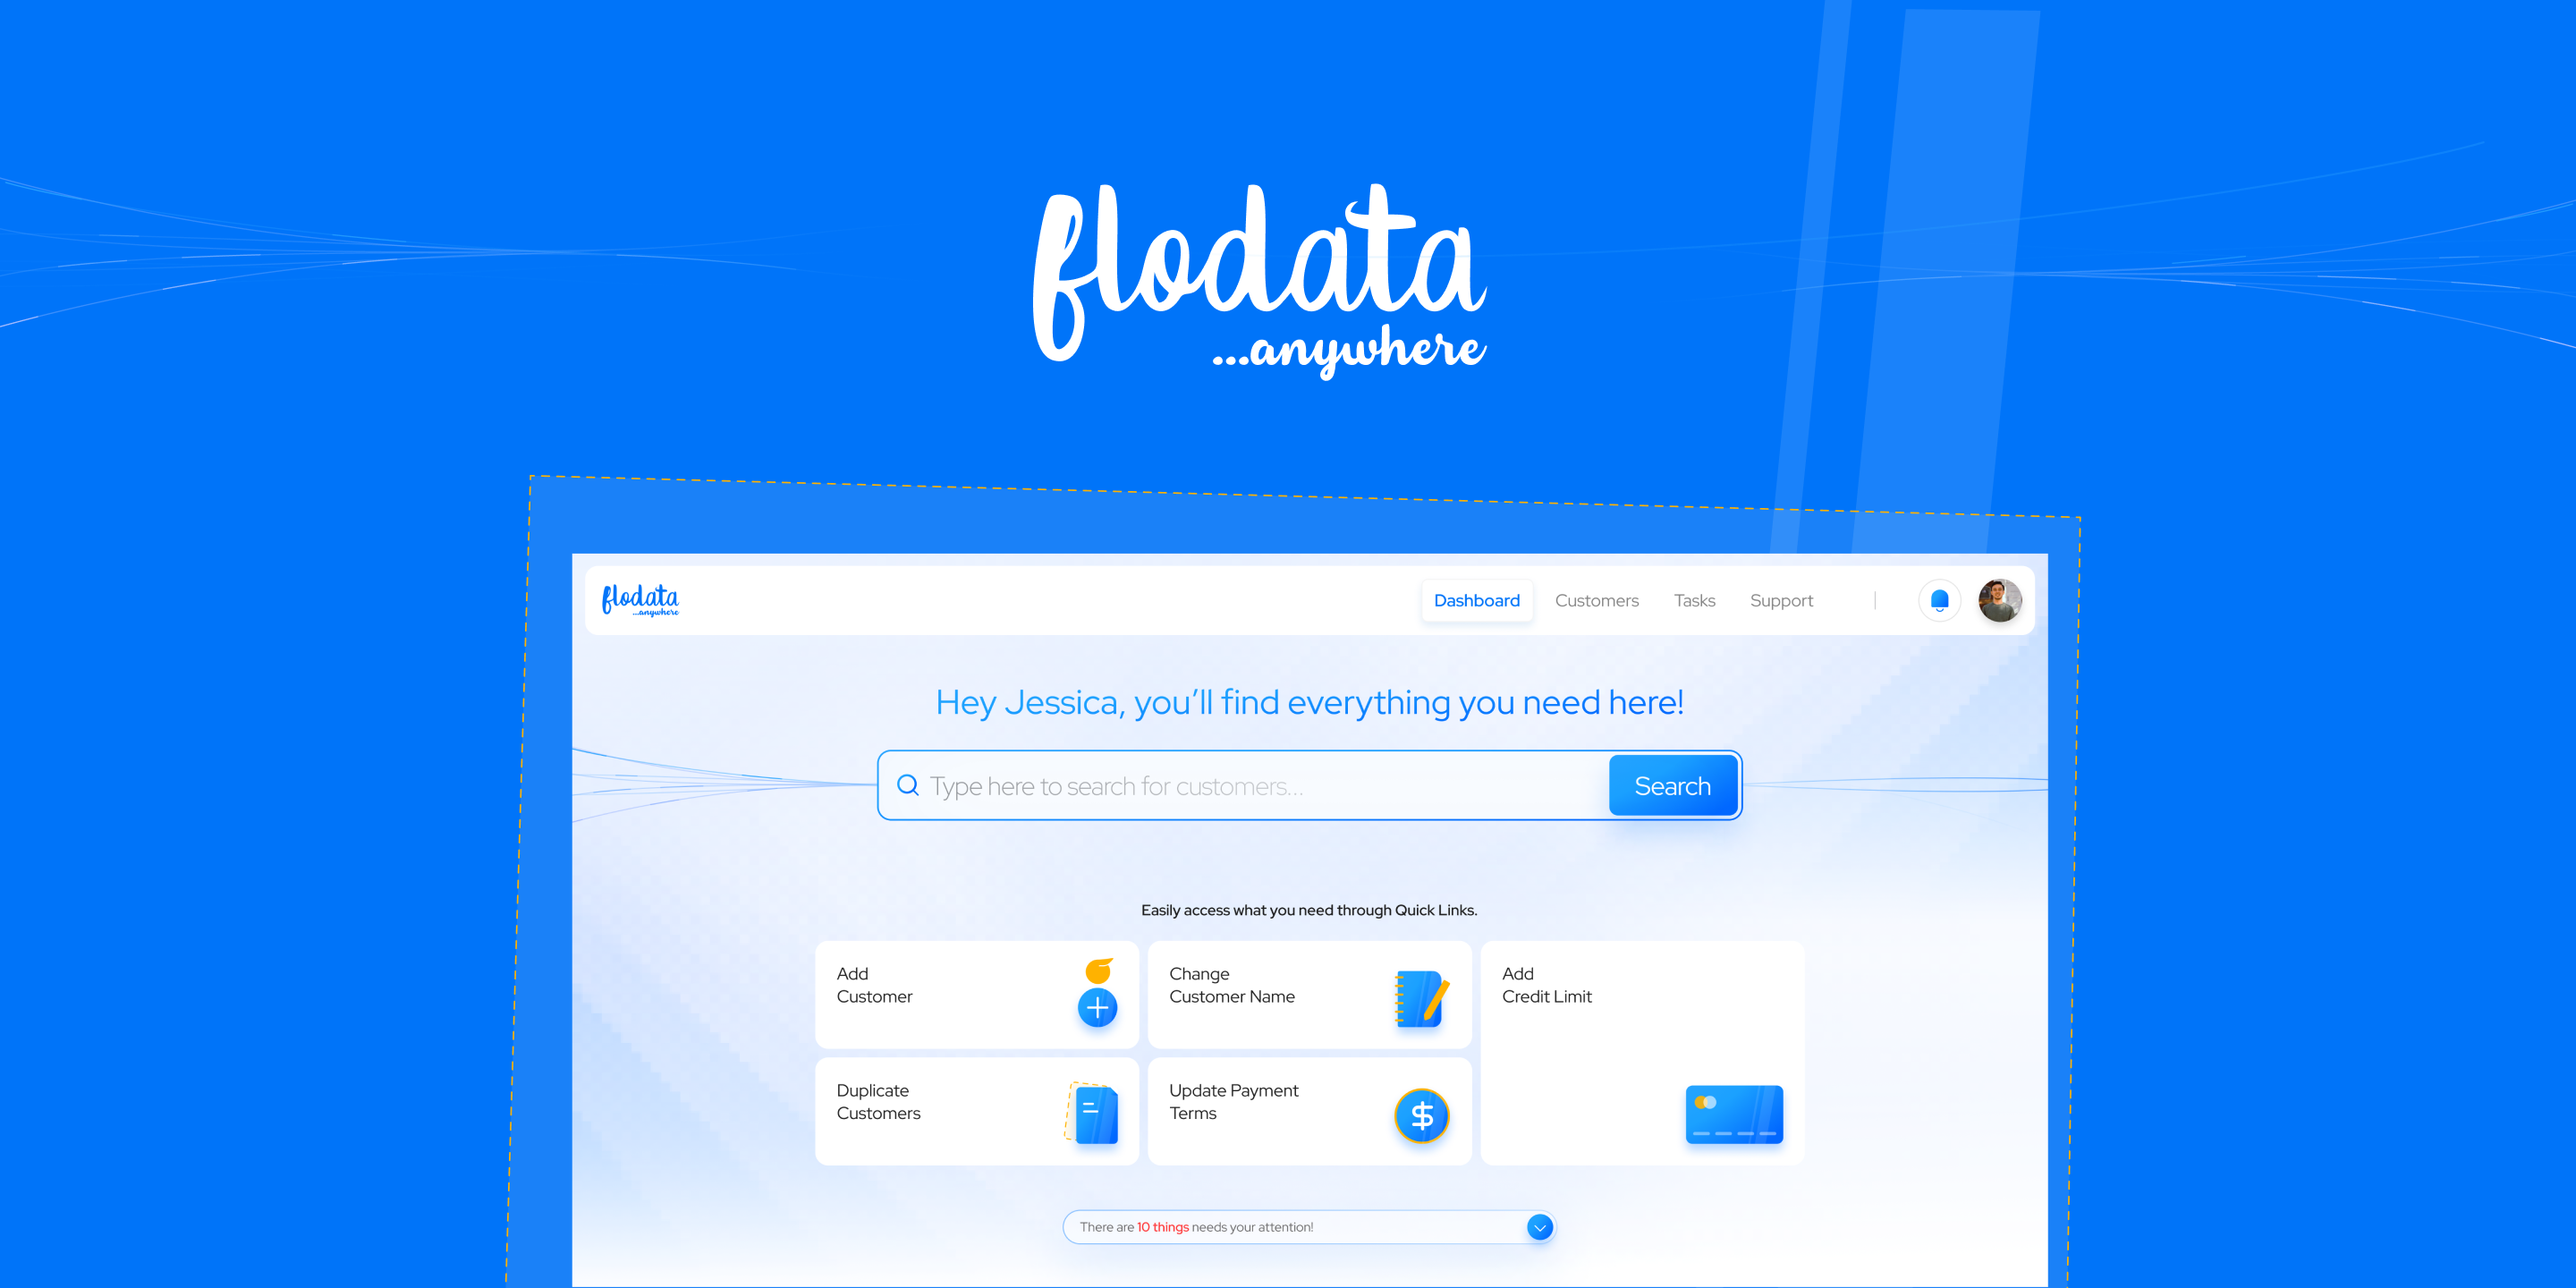
The landing experience was redesigned as a role-adaptive system. On login, the platform determines the user's role and configures the dashboard accordingly, surfacing the metrics, alerts, and quick actions most relevant to that person's job. A data steward sees data quality scores and duplicate alerts. An IT admin sees job status and pipeline health. A business analyst sees entity counts and data freshness indicators.
The critical design decision was to make role-adaptation invisible. Users should not see a role selector or a customisation panel, they should simply open the platform and find that it already understands them. The intelligence should be infrastructure, not feature.
Canvas View, Rules Management Without Code
This was the idea that was never in the brief, and the one that delivered the most value. The MDM rules engine is the heart of the platform: it defines how records from different sources are matched, merged, and governed. In the original platform, configuring rules required technical knowledge, essentially, writing logic in a structured query interface.
The Canvas View reimagined rules management as a visual, node-based editor, closer to a workflow design tool than a database interface. Rules are represented as connected nodes on a canvas. Non-technical users can build and modify matching logic by connecting, configuring, and rearranging nodes, with zero code required. The canvas metaphor was chosen deliberately: it required almost no training, because the interaction model, drag, connect, configure, was already familiar from other tools users encountered in their professional lives.
The result was a feature that genuinely expanded the addressable user base for the rules engine, moving governance from a developer-only capability to something that empowered data stewards and business analysts to own their own data quality rules.
Predictive Search, The Universal Entry Point
The second idea that was not in the brief: a search-driven navigation paradigm. The insight came from observing how users actually approached the platform, they always started with a question. "Show me all customers in this region." "Find duplicate records for this entity." "What jobs ran yesterday?" The existing navigation required users to know where to go to find what they needed. The redesigned search allowed them to just ask.
The search interface was designed with predictive suggestions that understood MDM context, surfacing entity types, job names, rule identifiers, and data source names as users typed. Quick links on the landing page provided one-click access to the most common starting points. The goal was to make the first ten seconds of every session effortless, removing the navigation tax that enterprise users pay every time they open a new tool.
AI-Powered Data Merge, Reducing Manual Error
Data merging, the process of combining records identified as duplicates into a single golden record, was one of the most error-prone operations in the platform. The redesign introduced an AI-powered merge interface that pre-populated merge decisions based on confidence scores, highlighted conflicting field values with contextual explanations, and allowed data stewards to review and override AI recommendations with a single action. Manual errors in this workflow had downstream consequences across every system that consumed the master data, reducing them was not a UX improvement, it was a data integrity improvement.
Run History & Analytics, Transparency as a Feature
Enterprise MDM platforms often treat operational transparency as an afterthought, logs exist, but they are difficult to read and impossible to act on. The redesigned run history and analytics layer made job performance visible, legible, and actionable. Trend lines showed whether data quality was improving or degrading over time. Drill-down capability allowed admins to move from a failed job summary to the specific record that caused the failure. The insight: transparency is not just about accountability. It is about building the institutional knowledge that makes data governance better over time.
The platform went from something engineers operated
to something everyone could use.
AI-driven search and centralised Insights & Alerts streamlined workflows, reducing the time from login to action for every user type.
The Canvas View and role-based dashboards enabled non-technical users to navigate complex processes independently, no IT support required.
AI-powered data merge minimised manual errors, reduced duplicate records, and ensured reliable data across all downstream systems.
Comprehensive analytics with run history gave every user actionable insight into data quality trends, not just a snapshot of current state.
Two major features that were never in the scope, Canvas View and predictive search, were adopted because the questioning process earned the credibility to propose them.
Enterprise software often fails not because it lacks features, but because it exposes complexity instead of managing it. The interface that knows who you are, and decides what to hide based on that knowledge, that is the highest form of enterprise UX. The Canvas View was a visual answer to a human question. The predictive search was a navigational answer to a cognitive question. Neither required more technical complexity. Both required more design thinking.
What FloData taught me about earning the right
to change the brief.
The most valuable thing that happened on this project was not a design decision, it was a conversation. The deep questioning process that uncovered the Canvas View opportunity required credibility. And credibility in enterprise UX is earned by demonstrating that you understand the domain as well as the stakeholders do, sometimes better.
The lesson: domain depth is not optional in enterprise design. You cannot design for MDM without understanding what matching logic does. You cannot design for data stewards without understanding what a golden record means and why it matters. The willingness to go deep, to ask questions that reveal gaps in the brief, to challenge assumptions about what users can and cannot handle, is what separates a design partner from a design vendor.
The second lesson: the best features are often the ones the client did not know they needed. This is not about being clever. It is about being curious. The Canvas View existed because we kept asking "and then what?" until we found the point where the existing platform broke down for non-technical users. That question, "and then what?", is one of the most powerful tools in enterprise UX work.
"When the interface knows who you are, it can decide what to hide. That single decision, what to surface and what to suppress for each user, unlocked adoption from the users who needed the platform most but had always been excluded from it."
To comply with my NDA, sensitive or confidential information has been removed and disguised. All information is my own and does not necessarily reflect the views of FloData. Want to know more? Let's get on a call →
Want to discuss this further?